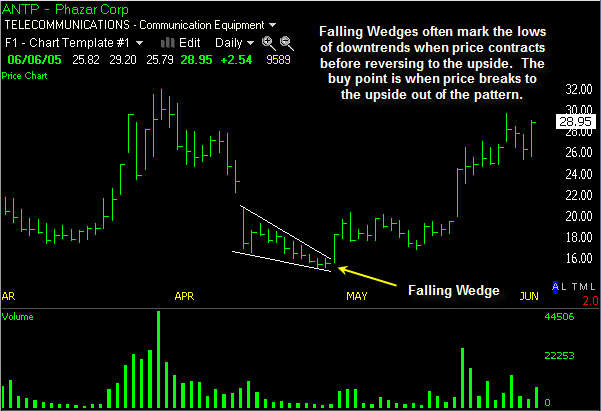
http://chart-patterns.netfirms.com/fallingwedge.htm Falling Wedge Bullish Reversal |
Falling wedge in a downtrend is a decline to a new low on strong volume, several weeks of range-bound trade characterized by lower lows and lower highs with contracting volume, followed by a sharp break higher on strong volume. It is important to note, unlike all other chart patterns, valid falling wedge patterns can be either continuation or reversal patterns.
Falling wedges in downtrends are usually part of larger reversal trends so the implications for the pattern are modest. Technical targets are derived by adding the height of pattern to the eventual breakout level. The breakout level will be determined by a trend line drawn from the area of initial consolidation through the reaction high.

The Wedge Formation is also similar to a symmetrical triangle in appearance, in that they have converging trendlines that come together at an apex. However, wedges are distinguished by a noticeable slant, either to the upside or to the downside. As with triangles, volume should diminish during its formation and increase on its resolve.
A falling wedge is generally considered bullish and is usually found in up-trends. But it can also be found in downtrends as well. The implication however is still generally bullish. This pattern is marked by a series of lower tops and lower bottoms.
- Prior Trend: To qualify as a reversal pattern, there must be a prior trend to reverse. Ideally, the falling wedge will form after an extended downtrend and mark the final low. The pattern usually forms over a 3-6 month period and the preceding downtrend should be at least 3 months old.
- Upper Resistance Line: It takes at least two reaction highs to form the upper resistance line, ideally three. Each reaction high should be lower than the previous highs.
- Lower Support Line: At least two reaction lows are required to form the lower support line. Each reaction low should be lower than the previous lows.
- Contraction: The upper resistance line and lower support line converge to form a cone as the pattern matures. The reaction lows still penetrate the previous lows, but this penetration becomes shallower. Shallower lows indicate a decrease in selling pressure and create a lower support line with less negative slope than the upper resistance line.
- Resistance Break: Bullish confirmation of the pattern does not come until the resistance line is broken in convincing fashion. It is sometimes prudent to wait for a break above the previous reaction high for further confirmation. Once resistance is broken, there can sometimes be a correction to test the newfound support level.
- Volume: While volume is not particularly important on rising wedges, it is an essential ingredient to confirm a falling wedge breakout. Without an expansion of volume, the breakout will lack conviction and be vulnerable to failure.
|
|


 Thread abonnieren


