


Der Doomsday Bären-Thread
 Thread abonnieren
|
--button_text--
interessant
|
|
witzig
|
|
gut analysiert
|
|
informativ
|
80


Hier mal ein Thread für verstiegene Pessimisten, brummige Bären, notorische Nörgler, weltfremde Wehleider, klagende Kassandras, grenzdebile Doomsday-Propheten. Es muss nicht
... (automatisch gekürzt) ...
Moderation
Zeitpunkt: 11.02.07 15:37
Aktion: Kürzung des Beitrages
Kommentar: Urheberrechtsverletzung, bitte nur zitieren
Zeitpunkt: 11.02.07 15:37
Aktion: Kürzung des Beitrages
Kommentar: Urheberrechtsverletzung, bitte nur zitieren
Optionen
| Antwort einfügen |
| Boardmail an "Anti Lemming" |
|
Wertpapier:
BP plc
|
4
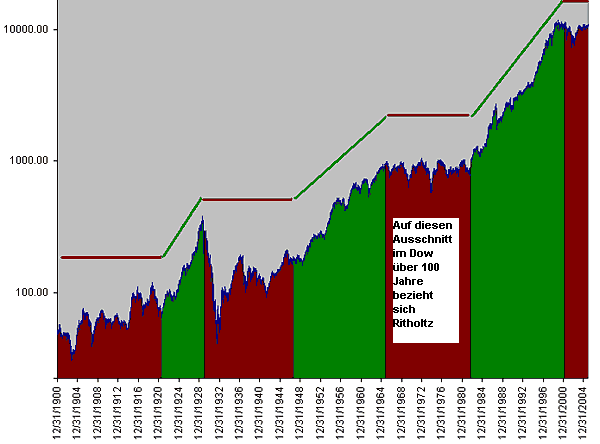
Ritholtz' These ist, dass die derzeitige "technische Erholung" der Aktien-Indizes ab März 2003 (Beginn des Irakkriegs) sich nun ihrem Ende nähert - vergleichbar dem 32-monatigen Anstieg von Mai 1970 bis November 1973 (schwarzer Pfeil) in der Grafik unten (zweite grüne Linie). Nun soll, nach Ritholtz, die Abwärtsbewegung folgen, die den DOW auf 7000 runter bringt (rot, darauf folgend).
Cult of the Bear, Part I
By Barry Ritholtz
RealMoney.com Contributor
1/5/2006 7:18 AM EST
As 2006 begins, I'm at the bottom of the barrel, bringing up the rear, and the proverbial low man on the totem pole ... and I'm not talking about being in the doghouse with the Mrs. for excessive partying on New Year's Eve.
Rather, I refer to having the very lowest market prediction -- and by more than 2,000 Dow points (!) -- in the 2006 Business Week market forecasts.
In this column and one to follow, I'll describe my top down, macroeconomic process, and how I derived my improbable forecast. I'll also review some market history and explain how, after all the arguments have been made, these long-term charts reveal the most compelling reason to be cautious on U.S. equities into 2006.
If I were a weatherman, my forecast would be 50% chance of heavy showers --- despite the "sunshine" that greeted investors on the first trading day of 2006.
War Games
As part of their strategic planning, the Pentagon plays out various military scenarios: A land war in Europe, a U.S. invasion of Iraq, a revolution in South America. During the Cold War, Strategic Analysis Simulation was the mother of all war games, modeling nuclear confrontation between the U.S. and U.S.S.R.
These exercises allow for multiple variables and outcomes: Winning was less important than teasing out how different scenarios could unfold. Strategic planners wanted to learn how decisions were made in the field, where surprises may develop, how unforeseen events could cause a "domino effect."
I used similar war-gaming techniques to consider what might happen next year. Only instead of nuclear conflagration, I think about consumer spending, corporate expenditures and hiring. What might happen to real estate prices, and how will that impact other elements? Will the demand for commodities continue to increase? Will Asian growth stay strong? What will Congress do: taxes, spending, deficits, politics? What are the political wild cards? I wonder how inflation will impact all of it, and what the Federal Reserve might do, including the expected -- and the unexpected.
While doing all this war-gaming, one scenario kept coming up repeatedly: The slow-motion slowdown. It starts with the consumer, who after years of spending, finally tires. Soon, it infects corporate revenue and profits. Slowly, it cascades its way across different sectors: housing, durable goods, discretionary spending, entertainment. Eventually, the decay spooks the markets.
The Crowd Is Bullish
There is a lot of anecdotal chatter about sentiment , but I prefer to stick with quantitative data. I hear too many people say, "All my colleagues/friends/brother-in-laws are (fill in the blank)." That's meaningless.
The Business Week survey reveals one group of bullishness. When I made my guess, I never figured I would be the outlier to the downside. Silly me.
One alternative to conjuring up various scenarios would be to simply extrapolate this year into next. I suspect that's why so many forecasters cluster around the same numbers. Most of the surveyed group is clustered between 11,000 and 2,000 (about plus 5%-10%) on the Dow, while advising a 40% to 75% U.S. equity exposure.
But its not just the Pros: Other surveys reveal a similar bullishness. A WSJ.com poll of more than 5,000 people taken on Dec. 30 shows 46% expect the same thing in 2006 as the market gurus: between Dow 11,000-12,000. Another 12% think we end up at more that 12,000. About 22% expect to end 2006 unchanged. Only 9% expect we will see the Dow between 10,000 and 10,500 -- a mild correction of less than 10%. Just 11% believe the Dow will drop below 10,000.
This means 89% of these WSJ readers do not believe 2006 will be a substantially down year.
Note that the crowd isn't extremely bullish, however. It will take one more rally toward 11,000 to get investors to breathlessly embrace the market. Then the trap door gets sprung.
I understand why the crowd is so bullish. The past few years have seen terrific data points: S&P 500 earnings have grown by double digits for 14 consecutive quarters. Companies are awash in cash; they have been buying back shares at the most rapid rate we've seen since the late 1990s; more than $456 billion worth in 2005, according to TrimTabs Investment Research. Since the dividend tax rate was slashed to 15%, the number of companies issuing dividends has increased, and pre-existing yield-payers have upped their dividends significantly. That's before we get to the record-setting M&A activity last year.
Despite all of these elements, the markets are essentially unchanged. Look at any U.S. index for the past one or two-year period -- or even four or five -- and there's been very little progress made. Except for the pre-Iraq war selloff and subsequent snapback, and the rally from the October 2005 lows, there hasn't been much of a market gain. Aren't you curious as to why that is?
Cult of the Bear, Part 2
By Barry Ritholtz
RealMoney.com Contributor
1/9/2006 7:12 AM EST
In part 1, we reviewed my forecasting process, and considered some reasons why -- despite its bullish start -- 2006 might be rocky for U.S. equities. Today, we go to the charts.
The 100-Year Dow
Humans are particularly bad at thinking about long periods of time. We have evolved with much shorter cycles: A daily sunrise, a monthly full moon, annual seasonal changes. Longer periods of time are outside of our personal experience. They create an analytical blind spot.
When we look at the "long term," we discover interesting things. Consider each "market" period in this 100-year chart.
Regardless of how each one ends, every bull market over the past century has been followed by a significant refractory period. As the chart shows, it takes quite a while to recover from a crash. Some of this is due to the destruction of capital. At the end of bull markets, many indutries end up with excess capacity (think optical fiber or telecom.) But do not overlook the large psychological component of the pain incurred by investors. The damage gets repaired when investors finally forget about the pain they suffered -- or when a new crop of investors (without scars) finally appears.
Today, market junkies have a new mistress: homes. Their former passion for stocks has been replaced. As we have seen, their equity wounds -- plus 46-year low interest rates -- has made real estate the new hottie. My guess is that nothing short of a large and sustained move upward (e.g. several quarters) will rekindle their love affair with equities.
How likely is that? Is it possible that an 18-year bull market (1982-2000) could be followed by a two-and-a-half-year bear (March 2000 peak to October 2002 low), then followed by another multidecade (2003-2018) bull? Sure, anything is possible. But as the chart above shows, it would be historically unprecedented.
16-Year Trading Range
On the 100-year chart, take a close look at the bear market prior to the most recent bull. It's the 1966-82 trading range. On the long-term chart, it looks like a fairly benign flat range. In reality, it was a volatile, dangerous period.
Assuming we are, in fact, in a long, post-bull trading range, than this is year five (give or take) of what could be a 10- to-15 year secular bear market. As the 1966-82 experiences shows, we may be in for violent moves down and rapid blastoffs.
The 1966-82 experience says we may be in for violent moves down and rapid blastoffs
If we are repeating the 1966-82 experience, I'd say we are somewhere around 1972-73. The similarities are imperfect -- especially regarding interest rates -- but an unpopular war, a potentially scandal-ridden second-term president with low poll numbers, and the end of a 20-year bull run five years prior are too similar to ignore. Compare the numbers: the Dow is up 45% from its October 2002 low and the S&P by about 60%. That parallels the Dow's 67% gain from the 1970 low to the 1973 peak .
The next chart reveals what is known as the four-year, or presidential, cycle. The theory behind this is that U.S. markets have a tendency to make a low in the second year of a president's term and a high in the fourth year. It has held up quite well historically, with the notable omission of 1986. Recall, however, what happened in 1987.
The chart suggests that cyclicality is at play. Given the upward bias of markets over time, regular corrections of 20% or greater may be inevitable.
What is truly astonishing is the very human propensity to downplay or even ignore these periodic dislocations. The classic example is the tendency of humans to build homes in earthquake zones, in flood plains, where tsunamis have previously hit -- even near volcanoes (!). Investors have similar blind spots.
P/E Ratios Are Not Cheap
The chart below covers the S&P 500 and its P/E ratio over the course of 1982-2000 bull market. Note that the P/Es started at 7 and rose to nearly 50. The median P/E went as high as 32.
There are those who claim that P/E expansion isn't all that significant to market performance; they argue it is a function of falling interest rates. A better explanation is psychology: Something shifted in investor sentiment that made them willing to pay more than $7 for a $1 of earnings -- in fact, almost $50 per. That change is best explained by a sentiment shift related to perceived relative value.
Most investors do not think about P/E expansion as the lion's share of the market's gains. Instead, they credit a robust economy, technological advances, productivity gains, and (of course!) earnings improvement.
All those elements did have an obvious impact . By my calculations, they were responsible for about 25% of the gains.
But the biggest contribution of these elements was not to the bottom line; rather, it was to investor sentiment. This "fantastic four" allowed investors to rationalize higher prices: Aren't stocks worth more if the economy is doing well? Doesn't technology make companies more efficient? If workers are more productive, then earnings will be all the more better.
While rational, these are hardly easily quantifiable data points.
Multiple Expansion and Mean Reversion
So what does this have to do with this year's market performance? Nearly everything.
Do not forget that the process works in reverse, as well. Post-crash, there is an increasing unwillingness to pay more for a dollar of earnings. Indeed, that's why we are seeing the market making so little progress, despite all the "good data." Investors are unwilling to pay more for earnings. The machinery is spinning furiously simply to stay in place. Without share buybacks and dividend increases, market performance would be much worse.
This is the psychological issue referenced above. Why worry about corporate malfeasance, earnings misses and bad management? Instead, fix up your home and watch it appreciate! And, it won't get marked to market every day (less stress), and, unless you live near a toxic waste dump, it won't go to zero.
This explains how sentiment affects multiple compression. But does this process have a mathematical explanation?
Yes: Mean reversion is the process by which earnings ratios oscillate above and below its long-term average. And markets do not seem to stop on their means. Instead, they swing wildly above and below.
The accompanying chart shows we have been way above the historical averages for P/E ratios. From 1955 to 2005, the median P/E was 17. Stocks may not be terribly expensive at present, but they are hardly cheap by historical measures. An even more discouraging analysis comes from Clifford Asness of AQR Capital Management. He calculated the P/E ratios for the entire market from 1871 to 2003 at about 11. That suggests stocks are even less cheap (or more expensive) than is implied by our measure of "only" the past 50.
Whether you take the 50- or the 132-year perspective, the theory of reversion to the mean implies that stocks likely will become even cheaper as P/Es revert to the mean -- and then overshoot.
P.S.: I know "P/E mean reversion" has been the mantra of the permabears since the bubble burst (if not prior), causing most to miss the rally from the October 2002 lows. But that doesn't mean they're entirely wrong or that the theory should be dismissed.
Over the long term, I do believe P/Es will ultimately revert back to average levels, after falling below for a period. But there certainly are going to be short-term opportunities within the longer-term reversion cycle and, unlike the permabears, I've made various bull/bear calls such as here and here.
Despite accusations from critics and inflammatory headline writers, I am not part of the "Cult of the Bear."
In part 3, I'll tie together the top-down approach from part 1 and the technical factors discussed above to show how I got to my 2006 forecast of Dow 6800 and S&P 880.
Cult of the Bear III: Getting to Dow 6800
By Barry Ritholtz
RealMoney.com Contributor
1/18/2006 7:24 AM EST
Part I of this series reviewed our stimulus driven, real estate-reliant, post-bubble economy. Part II looked at the cycles of bull and bear markets, and how history suggests trouble ahead for U.S. stocks -- despite the strong start to 2006.
Today we focus on how it could all come together or, as the case may be, come apart. I'll detail how to get to my 2006 target of Dow 6800 -- the lowest (by far) in the Business Week survey -- and lay out a scenario for how the S&P 500 could take a 30% haircut this year.
Before the Fall
With everyone so focused on the bearish year-end forecast, many have overlooked my expectations for early 2006. As the Business Week survey shows, my first half Nasdaq prediction of 2620 was the single most bullish in the group, while my mid-year S&P call of 1350 was in the top 10 of nearly 80 forecasters. I also forecast Dow 11,800 by mid-year. (For the record, the survey was conducted in early December.)
Why the bull call before the fall? Because that's how market tops get made: In the 12 months leading up to the October 1987 highs, the Dow ran from 1800 to 2700 (a 50% gain), while the S&P 500 sprinted from under 240 to about 340 (about 42%). From October 1999 to March 2000, the Nasdaq nearly doubled. Although I don't expect anywhere near those gains in the first half of 2006, the pattern could be quite similar: A leap to new highs on some widely held assumption, which subsequently turns out to be false.
In the present case, several suppositions potentially fit the bill: The widespread expectations that the Federal Reserve will halt tightening sooner rather than later and that the U.S. consumer will keep spending. And do you know anyone who doesn't believe earnings will remain robust?
The Case of the Overdue Correction
One oddity of the move off of the prewar lows in 2003 is that the S&P 500 has yet to have a 10% correction. During the bull market period from 1996-2000, there were six corrections of 10% or more. Since the bottom on March 5, 2003, the S&P has sustained only three corrections of more than 6% and none greater than 9%.
Regular corrections serve a purpose for healthy markets: They cleanse the excesses that tend to develop, allowing further gains to proceed.
The lack of a 10% correction reveals high levels of complacency -- something the CBOE Market Volatility Index (VIX) has been implying for quite some time. This creates "air pockets" -- soft spots in the base of support that can potentially become more vulnerable to selling in the event of a test. As the 1966-1982 chart shows [gezeigt in Posting 4 dieses Threads, A.L.], broad trading ranges typically experience much greater than 10% corrections. Considering how regularly markets pull back and test support, the longer we go without that 10% correction, the greater the possibility of a steeper and deeper downturn.
The suggestion of a 30% fall in the S&P 500 has engendered widespread disbelief; investors broadly discount the mere possibility of such a correction. But as the nearby chart shows, there were five corrections that ranged in strength from 25% to 45% from 1966 to 1982. That averages out to one major correction every 38 months or so. The S&P's last major correction was a 33% drop from March to July 2002. That was 42 months ago -- implying we are overdue for another steep decline.
Structural Imbalances Create Vulnerability
Past crises such as the Asian currency crisis and the Long-Term Capital Management meltdown were able to be managed because of economic strength. When they occurred, markets were in the midst of a bull run and the economy was growing organically. The Fed had lots of room to add liquidity. The economy shuddered a bit, but handled these shocks well.
Ups and Downs
Today, the economy has far greater structural imbalances. As the markets get further extended, they become increasingly less able to absorb what has become euphemistically described as "an externality." As the current account deficit rises and the U.S. fiscal deficit worsens, so too does our ability to shake off an economic disturbance. Nouriel Roubini, professor of economics at New York University's Stern School of Business, calls this an "increased probability of a systemic risk episode."
Getting to 6800
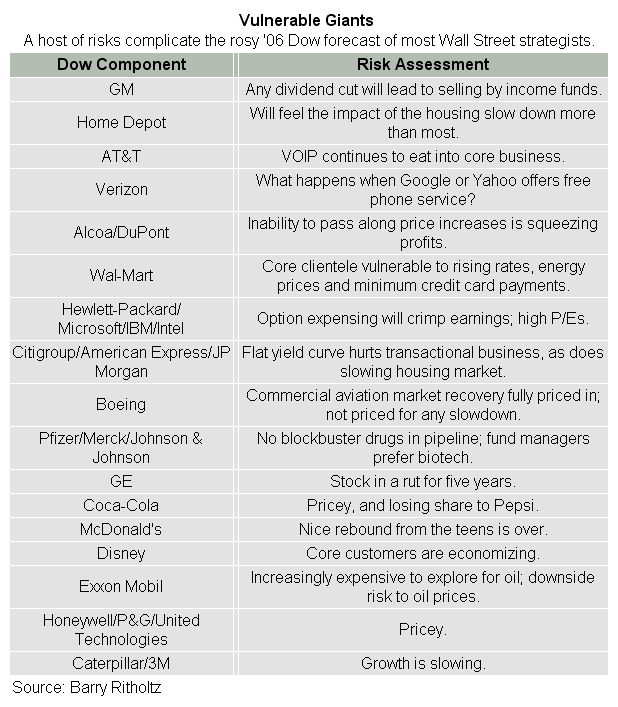
What would have to occur for 2006 to be the strong year for the Dow many are expecting? Forget Goldilocks, we would need a Cinderella scenario, where nothing goes wrong, and many things go precisely right: Earnings must stay robust, while energy prices and inflation moderate. The consumer would have to keep spending, despite signs of tiring. Businesses would need to build on third-quarter capex spending, and begin to hire in earnest. All of the vulnerable Dow stocks would have to avoid their major issues, or even a minor hiccup.
None of the negative "externalities" currently contemplated -- from a major bird flu outbreak to protectionist legislation or other policy mistake to an energy shock to a dollar crash to a geopolitical crisis over Iran's nuclear ambitions -- can come to pass, much less something currently not on the radar. Finally, equities would somehow manage to avoid the regular corrections so common in secular bear markets.
If Cinderella fails to show, how might the Dow work its way down toward 6800?
The momentum from the beginning of the year should carry stocks higher into February. But a series of earnings disappointments and a few negative surprises from select names -- think DuPont (DD:NYSE) and Alcoa (AA:NYSE) -- creates a wobbly market. Disappointments after the close Tuesday from IBM (IBM:NYSE) , Intel (INTC:Nasdaq) and Yahoo! (YHOO:Nasdaq) won't help matters and may prevent the early 2006 momentum from carrying as far as I originally thought.
Investors start to gradually recognize that all is not well in the economy. The P/E multiple compression discussed in part II only adds pressure to stock prices, as does options-expensing. Companies on calendar years are required to expense options, starting this quarter. The effects of expensing options will be seen in first-quarter and full-year guidance.
This scenario won't collapse the market, but makes it vulnerable.
Perhaps the first-quarter rally has trouble gaining traction in the second. A modest downslide starts, as first-quarter earnings are reported. The bulls declare it a mere retracement and buying opportunity. But it turns out not to be; by the second quarter, the cyclical high for 2006 already has been put in.
How does this possibly get us to 6800? The Dow is calculated via a divisor, currently 0.12493117.
A point [= 1 Dollar, A.L.] of each Dow stock's movement is equal to a little over 8 points on the index. It's not too hard to imagine that as earnings slow, stocks begin to soften. A loss of 5 points on each component adds up to a Dow drop of 1,200 points (40 points times 30 stocks = 1200) -- that brings us to Dow 9800. And that's only 5 points; a 10-point-per-Dow-stock drop would drive the average to 8600.
All it will take will be a modest earnings slowdown, and the Dow slips below 10,000. That happens, and apprehension levels rise in earnest. Dip-buyers who bought stocks 1,000 points higher are upside-down.
Now imagine what happens if any of the highfliers -- say Google (GOOG:Nasdaq) or Apple (AAPL:Nasdaq) has a miss, or simply lowers guidance to reflect the slowing consumer. Or perhaps Home Depot (HD:NYSE) and Lowe's (LOW:NYSE) feel the pinch of slowing housing and refinancing activity.
Given the heavily promotional holiday-price cuts, I expect that many retailers -- Wal-Mart (WMT:NYSE) , Target (TGT:NYSE) on the low end, Tiffany (TIF:NYSE) and Nordstrom (JWN:NYSE) on the high end -- will see the margin pressure impact earnings.
The spillover effect will be substantial. And if the same happens in any one of the pricier Dow components -- Boeing (BA:NYSE) , United Technologies (UTX:NYSE) and 3M (MMM:NYSE) are all vulnerable -- we can easily see a day when the Dow is down 300 points.
In Japan, an investigation into Livedoor -- hardly a premier Internet company -- was a convenient excuse to whack the Nikkei 225 stock index down 462.08.
If breaking 10,000 will make traders nervous, below 9000 the fear levels will be palpable. At that point, any one of our laundry list of negative catalysts might come into play. In my war-gamed scenarios, the dollar doesn't have to go into crisis, and the avian pandemic need not kill millions; instead, the investing public need only become alarmed that something nasty might occur to take fear levels up toward panic.
The move from Dow 8800 to 6800 won't be a rational, calmly contemplated affair. No one will be quietly wondering about option-expensing or multiple compression. Instead, it will be a severe overreaction to some external event.
If and when that happens, it likely will be the best buying opportunity in the markets since the October 2002 cyclical lows.
Barry Ritholtz is the chief market strategist for Ritholtz Research, an independent institutional research firm, specializing in the analysis of macroeconomic trends and the capital markets. The firm's variant perspectives are applied to the fixed income, equity and commodity markets, both domestically and internationally.
Optionen
| Antwort einfügen |
| Boardmail an "Anti Lemming" |
|
Wertpapier:
BP plc
|
Angehängte Grafik:
bear2.gif (verkleinert auf 85%)

bear2.gif (verkleinert auf 85%)
5
Behält Ritzholtz Recht, gehören die nächsten zehn Jahren den Tradern, die die starken Schwankungen nutzen (siehe Chart zu Posting 2), während Buy-and-Hold-Anleger, also Langfrist-Investoren, per Saldo leer ausgehen - bis auf etwaige Dividenden.
Optionen
| Antwort einfügen |
| Boardmail an "Anti Lemming" |
|
Wertpapier:
BP plc
|
Angehängte Grafik:
bear1.gif (verkleinert auf 85%)
bear1.gif (verkleinert auf 85%)
2
Record Longs in Stocks and Bonds
01/27/2006 4:32 PM
We have new record longs collectively held by non-commercial traders (large speculators) in 10-year contracts and S&P 500 futures as of Tuesday, according to data released minutes ago by the Commodity Futures Trading Commission. It's worth noting that speculators are long crude oil for the first time since Sept. 6.
Optionen
| Antwort einfügen |
| Boardmail an "Anti Lemming" |
|
Wertpapier:
BP plc
|
0
Die derzeit extreme Risikofreudigkeit steht in diametralem Gegensatz zur Risiko-Scheu, die Anleger im März 2003 am Tief (zu Beginn des Irakkriegs) zeigten. Und genauso, wie die damalige Risiko-Scheu ein Kaufsignal war, kündet die aktuelle übertriebene Risikofreudigkeit ein spekulatives Hoch an. Wie tief es von da nach unten gehen kann, zeigte die Asienkrise 1997, als ebenfalls "zu viel" Geld in Schwellenländer geflossen war.
Den Todesstoß versetzte Thailand damals übrigens Superinvestor George Soros: Er wusste, dass die Dollar-Reserven Thailands nahe an einer kritischen unteren Schwelle standen. Also lieh er sich zig Milliarden in thailändischen Bath - angeblich als Kredit für seinen Quantum-Hedgefond. Als er die Baht erhalten hatte, tauschte er sie SOFORT in US-Dollar um. Dadurch vielen die Dollar-Reserven Thailands unter die kritische Schwelle. Folge: Der Bath wertete innerhalb von Wochen um 50 % ab. Als das geschehen war, zahlte Soros seinen Bath-Kredit vorzeitig zurück. Er benötigte dafür nur noch die Hälfte der Dollars, die er sich zuvor geliehen hatte. Die andere Hälfte blieb als Milliarden-schwerer Profit in seiner Tasche.
Zufällig warben um diese Zeit auch Normalo-Fonds wie Fidelity für thailändische Aktienfonds. "220 Prozent Rendite" gab es in den letzten zwei Jahren, verkündete der Prospekt. Im Kleingedruckten stand aber auch, dass "Gewinne der Vergangenheit keine Garantie für zukünftige Gewinne" seien. So war es denn auch: Als Soros das Bath gekillt hatte, saßen die "Emerging-Market"-Investoren auf horrenden Verlusten. Die Asienkrise war daher eine gigantische Umverteilung: Das Geld floss aus den Taschen der Kleinanleger in die Fonds, bis Soros es abräumte.
In der Wirtschaftspresse wird dies oft falsch dargestellt. Da heißt es nach Crashs immer: "Milliarden an Anlegergeldern wurden vernichtet". In Asien brannten jedoch keine Dollar-Berge. Sie wechselten lediglich den Besitzer.
FTD, 30.1.06
Wo Bares noch Wahres ist
von Martin Diekmann
Während Aktien- und Rentenanleger mit den Kursgewinnen der vergangenen Jahre durchaus zufrieden sein dürften, sind Bargeld-Anhänger alles andere als glücklich. Die meisten Euro- und Dollar-Festverzinslichen gleichen gerade einmal die Inflationsrate aus.
Dementsprechend mickrig fällt die Performance bei den Euro-Geldmarktfonds aus. Die besten erreichen auf Sicht von zwölf Monaten gerade einmal einen Zuwachs von 2,5 Prozent. Doch seit kurzem bieten zwei Investmentgesellschaften eine Alternative: Der deutsche Branchenprimus DWS und die österreichische Erste Sparinvest bieten jeweils einen Cashfonds, der in die Zinsmärkte von Schwellenländern investiert. "Die Rendite unseres Fonds beträgt derzeit 5,7 Prozent", sagt Peter Svoboda, Fondsmanager des Ende November vergangenen Jahres aufgelegten ESPA Cash Emerging Markets. Der Fonds ist derzeit nur in Österreich zum Vertrieb zugelassen, die deutsche Vertriebserlaubnis soll in den nächsten Wochen folgen. Bereits seit April 2005 ist der "DWS Invest Emerging Yield Plus"-Fonds hier zu Lande am Markt und erreichte seitdem eine Performance von 7,25 Prozent.
Verantwortlich für die erheblichen Renditeunterschiede zu Euro-Fonds sind die lokalen Zinssätze in den Emerging Markets, die häufig um ein Vielfaches über denen des Euro-Raums liegen. "In Brasilien werfen Zinspapiere derzeit etwa 16,5 Prozent Rendite pro Jahr ab", so Svoboda. "In Indonesien sind es 16 Prozent, in der Türkei 14,8 und in Mexiko 7,9 Prozent."
Hatten die hohen Zinssätze ihren Ursprung in der Vergangenheit ausschließlich in der politischen und wirtschaftlichen Instabilität und der Abhängigkeit von ausländischen Kapitalgebern, ist der Grund mittlerweile ein anderer. "Heute spiegeln die hohen Zinsen auch die wirtschaftliche Dynamik in den entsprechenden Ländern wider",...
["Diesmal ist Alles anders", sagten auch Leute, die im März 2000 Aktien kauften - A.L.]
...sagt Christian Schiweck, einer der verantwortlichen Manager des "DWS Invest Emerging Yield Plus"-Fonds. "Um diese Dynamik zumindest einigermaßen im Zaum zu halten, sind die Zinsen hoch. Damit sollen der Konsum gedrosselt und das Sparen attraktiver gemacht werden."
Doch die Manager profitieren nicht nur von den hohen Kupons, sondern auch von der Entwicklung der den Papieren zu Grunde liegenden lokalen Währungen. Das war in den vergangenen Jahren kein schlechtes Geschäft. So legte etwa der brasilianische Real in den vergangenen 36 Monaten um beinah 30 Prozent gegenüber dem Euro zu, die Türkische Lira um zehn Prozent und der polnische Zloty um mehr als 8,5 Prozent.
[In der "Tequila-Krise" 1994 wertete der mexikanische Peso in wenigen Wochen um die Hälfte ab. Es geht also auch "anders rum" - A.L.]
Treiber hinter dieser Entwicklung ist die globale Konvergenz. Bei Ländern, die wirtschaftlich erwachsen werden, verlaufen die Grundzüge der Entwicklung immer ähnlich: Direktinvestitionen erhöhen die Produktivität, der wirtschaftliche Aufschwung führt zur Aufwertung der entsprechenden Währung, das wiederum macht Produkte und Dienstleistungen teurer. Das ist eine Entwicklung, die sich bei den neuen EU-Staaten gut verfolgen lässt. "Der Prozess ist damit jedoch nicht abgeschlossen", so Schiweck. "Eine vergleichbare Entwicklung gibt es auch in Asien und Lateinamerika, nur erfolgt sie zeitverzögert."
Um möglichst keine Chance zu verpassen, investieren beide Fonds weltweit. Die DWS teilt die Gelder derzeit zu gleichen Teilen in Asien, Lateinamerika und Osteuropa auf. Die Manager des Erste-Sparinvest-Fonds legen das Schwergewicht mit mehr als 40 Prozent dagegen auf Osteuropa. Asien und Lateinamerika machen 22 und 23 Prozent aus, der Nahe Osten und Afrika kommen zusammen auf 14 Prozent.
Beide Fonds verzichten auf Währungsabsicherungen. [Typisch, ist ja "other people's money - A.L.] Schließlich würden sie sich damit eines Teils ihrer Chancen selbst berauben. "Trotzdem ist ein Investment weniger riskant, als man auf den ersten Blick glauben mag", sagt Schiweck. "Denn die hohen, teilweise zweistelligen Kupons sorgen für einen guten Sicherheitspuffer. Selbst wenn beispielsweise die brasilianische Währung Real um zehn Prozent abwerten sollte, blieben uns immer noch mehr als sechs Prozent Rendite", erklärt der Manager.
Die Anleger dürften bei der bislang erreichten Performance zwar strahlende Augen bekommen, allerdings zeigt der Vergleichsindex JP Morgan ELMI+, was wirklich für sie drin war. Auf Jahressicht legte er um 18,2 Prozent zu. Die DWS begründet das viel schlechtere Abschneiden ihres Fonds damit, dass dieser konservativer und damit sicherheitsbewusster als der Index gemanagt wird. Wenn dabei allerdings mehr als 50 Prozent der Performance auf der Strecke bleiben, ist das Ergebnis enttäuschend.
[Das haben die Fond-Manager auf Champagner-Partys verhurt, die wollen ja auch ihren Spaß - A.L.]
Optionen
| Antwort einfügen |
| Boardmail an "Anti Lemming" |
|
Wertpapier:
BP plc
|
0
Dieser Thread ist der Versuch, das Ganze mal etwas Humoriger anzugehen. Sozusagen mit britischem Humor...
Optionen
| Antwort einfügen |
| Boardmail an "Anti Lemming" |
|
Wertpapier:
BP plc
|
Angehängte Grafik:
baeren_aufbinden.gif

baeren_aufbinden.gif
2
Zeit von 2000 zurückversetzt. Ich habe ein ganz ungutes Gefühl.
Speziell in den USA sehe ich eine Menge Dinge die nicht so richtig in das
positive Gesamtbild passen wollen.
Was man auch schön an der schlechteren Performance der US Indices zum Dax
beobachten kann. Nur ob sich der Dax komplett vom US Markt abkoppeln kann, wage
ich zu bezweifeln. So lange wir im Dow keine nachhaltigen neuen Hochs haben, bleibe
ich doch eher skeptisch.
Deutsche Aktien kaufe ich seit längeren sowieso kaum noch.
Ich finde momentan den Rohstoffbereich und dort insbesondere GOLD/Silber,
Uran, Kupfer oder langsam auch die Soft Commodies bedeutend interessanter.
Wobei man gerade bei den Goldwerten momentan auch aufpassen sollte, da viele
Unternehmen schon sehr gut bewertet sind.
Aber solange Gold weiter steigt (und das wird noch ne ganze Zeit so bleiben)werden
auch die Bewertungen sehr hoch bleiben.
Wir werden sehen...
Grüße
Pate
Optionen
| Antwort einfügen |
| Boardmail an "Pate100" |
|
Wertpapier:
BP plc
|
0
Optionen
| Antwort einfügen |
| Boardmail an "Anti Lemming" |
|
Wertpapier:
BP plc
|
Angehängte Grafik:
vulnerable_giants.jpg (verkleinert auf 82%)
vulnerable_giants.jpg (verkleinert auf 82%)
2
Meiner Ansicht nach verhält sich der DAX wie ein Optionsschein auf die US-Indizes. Geht es drüben hoch, gibt es hier irrationalen Überschwang. Sinken die US-Indizes, macht sich hier Mega-Pessimismus/Grabesstimmung breit (z. B. Dax 2200 zu Beginn des Irakkriegs im März 2003).
Ich war bei DAX 2200 übrigens Käufer (CBK, HVB, DPF, SZG, TUI, ABN, ING u. a.)
Aus dem umgekehrten Grund bin ich jetzt überhaupt nicht investiert.
Optionen
| Antwort einfügen |
| Boardmail an "Anti Lemming" |
|
Wertpapier:
BP plc
|
1
Will bears have the last laugh?
Dow's gain likely to be just another fakeout
By Tomi Kilgore, CBS MarketWatch
Last Update: 1:30 PM ET Jan. 30, 2006
§
NEW YORK (MarketWatch) -- The only thing more frustrating than buying the high of a breakout, or selling at the low of a correction, is to keep doing it over and over.
False breakouts may be the most irritating market patterns, because they do two things: They keep you from being aggressive on the next breakout/breakdown, which could cost you a lot of opportunity; and it can make you question all the other signals that you've become accustomed to following.
While you can expect some sort of correction after a strong move, enough to make you question your resolve, but they are usually contained within predetermined support or resistance zones, at least on a closing basis.
The Dow industrials followed November's apparent upside breakout with an apparent breakdown in late December. If that wasn't enough, the mid-January breakout above 11,000 proved to be a head fake, and the Dow broke down yet again, closing last Friday at a 2-month low.
Now, after running up about 200 points since Thursday, it seems the Dow appears headed for another run to the upside, and bears appear to have been fooled yet again.
There are some signs that suggest, however, that it may be the bears who will have the last laugh.
Expanding triangle
The Dow may be producing false breakouts and breakdowns when looking at the chart in a two dimensional way (just up and down), but a three dimensional view (up, down and sideways) shows that it has been trading within a range referred to as a broadening, or expanding triangle.
The top of the range has been a rising trendline connecting the late-November and early-January highs. If the Dow's rally continues, it could climb up to 11,080 to extend this line.
Meanwhile, the bottom has been tracing out a downtrend line connecting the lows of early-December and early- and late-January. An extension of this line currently comes in at around 10,630.
This pattern indicates that market forces are getting impatient and uncertain at a time when fundamentals can be interpreted as mixed. With economic growth slowing, crude still rising, and a choppy corporate profit outlook, perhaps the market appears to be getting a bit too volatile for those looking for a more steady return.
You can see this via the chart of the market's so-called "fear gauge" the CBOE Volatility Index (VIX). It spiked up 2 1/2-month high of 14.56 on Jan. 20 before pulling back. The breakout in volatility hasn't been negated yet, as it has fallen back to support just above the gap in the charts between the Jan. 13 high of 11.61 and the Jan. 17 low of 11.87.
In addition, the gap appeared right after the creation of an inverted head-and-shoulders reversal pattern, with the mid-November and early-January lows the top of the upside down shoulders, and the mid-December low the top of the head. This suggests support should be rather strong, and that the fear gauge [VIX - A.L.] is likely on the verge of starting another rally. It traded up 2.2% to $12.23 in midday trading on Monday, despite gains in the major stock market indexes.
When investors are uncertain -- and more so when they are afraid -- they tend to close out positions. Therefore, expanding triangles tend to be resolved in the opposite direction of the trend that preceded them.
Another pattern the Dow has been following is a little more subtle.
Negative divergence
When you are constantly being fooled by price levels, the mathematical technicals -- indicators derived by calculations of data over a specified time period -- can be a better way to find the underlying trend. Read more about mathematical technicals, or oscillators.
While the blue chip barometer has been making higher highs along with its lower lows, some of the oscillators have been consistently making lower highs and lower lows.
For instance, the relative strength index (RSI), which relates the strength of up days to down days, made a high of 75.16 in late-November and a high of 68.50 in early-January, while the Dow's highs increased from 10,959 to 11,047.
The momentum indicator, a study of the rate of change relative to prior movement, reached a high of 444.80 in mid-November, and a high of 206.30 in early-January. This pattern is recognized as "negative divergence," and is believed to be a sign of underlying weakness.
While these developments are not always good market timing tools -- markets could be in negative divergence for months, and even years -- they can at least point you in the right direction, especially during times of range trading, so when the real move does come, you are ready for it.
While an expanding triangle and negative divergence may not be a definitive signal for a downside reversal, the combination of the two indicators is worth noting.
Especially by those that are getting tired of being fooled.
Optionen
| Antwort einfügen |
| Boardmail an "Anti Lemming" |
|
Wertpapier:
BP plc
|
1
Die Diskussion fand ich so interessant, dass ich sie hier mal reinstelle:
Columnist Conversation
A few quick comments
Barry Ritholtz
1/27/06 7:31 AM EST
A couple of comments this morning:
1) Technicals remain strong, and continue to be the driving force short term. But economics look weak, and continue to be source of concern long term.
2) Last Friday's market actions was the market's early warning sign. Very heavy volume to the downside on a big selloff is never a good thing. I interpret that day as a foundational crack of the cyclical Bull market. Again, we are not looking for a 1987 situation, but rather a Q1 topping out, and an ugly rest of the year.
3) Gold also looks toppy -- it's well overdue for a 10% correction. We are short here, but would re-establish a long position in the 480-510 range.
4) A 500 point day in Japan is too exuberant -- it's a sign of very emotional trading. Historically, these sort of buying frenzies tend to end badly. As such, we are lowering our multiyear price target on the Nikkei down from 21,000 to 18,000. I would not be surprised to see this lowered again before year's end. And the Korean Topix, which I have liked for some time, is geting crazed. Still plenty of upside, but getting frothy...
Position: Short GLD
Heads I win, Tails I win
Norm Conley
1/27/06 9:17 AM EST
Barry, your comments this morning are confusing to me. On the one hand, you cite the huge upward move in the Nikkei as being "too exuberant" and that "historically, these sorts of buying frenzies tend to end badly."
On the other hand, you pick out last week's ugly sell-off in the U.S. as an "early warning sign" and a "foundational crack in the cyclical bull market."
It seems as if you are taking two outlier one-day moves in markets (one "up" move, and one "down" move), and extrapolating that although they are contradirectional, they both carry ominous portents.
First of all, that seems like a two-headed coin flip to me. Is it really true that single-day outlier return samples, either up or down, correlate with future negative rates of return? I've never, ever seen that kind of relationship in market history.
Secondly, any attempt to make market predictions based upon single-day price/volume statistics smacks of technical analysis. That's fine with me, because unlike a lot of market professionals I believe in using technical analysis. The problem I have is that you start off your post by saying that "technicals remain strong." But how do strong technical signals portend weak market action, anywhere outside of the Bizarro World of the old Superman comics?
My hunch is that you have a strongly-held bearish outlook, which is certainly nothing anyone should criticize you for - after all, you could certainly be correct. But it seems as if you are using every datapoint out there, even those that contradict your own outlook, to make a negative prognostication. Which is confusing.
Position: none
NORM!
Barry Ritholtz
1/27/06 9:46 AM EST
Norm,
You raise some fair points; Let's see if I can -- briefly -- explain further:
1) I was specifically referring to market internals (as opposed to chart patterns) when I said the technicals were strong: The Up/down ratio, advance/decline line, new 52 week highs, % of stocks over their 50 and 200 day moving average -- none of these are in a danger zone yet, and if anything, are positive.
2) Last Friday was down 2% on heavy volume; That's not a sign of excessive emotion or panic -- rather, its a sign of significant distribution by institutional sellers. That's rarely a one-day event. I interpret that as a warning sign of more trouble to come, as it reveals that big holders are willing to bail at early signs of trouble.
3) Japan up that huge is simply a buying frenzy. Clients of ours in Korea are telling me all the foreign cash flowing into the Kospi has engendered a giddy mayhem. (500 points! Geez!)
4) As I have mentioned previously, crowds are right -- don't fight the tape -- until they become an emotional mob. We are seeing early signs of that in Asia. Again, it doesn't mean it rolls over tomorrow, but as someone who has been Bullish on Japan for 2 years and Korea for 1, and most recently Malaysia, I fear we could be later in the investment cycle than I originally believed. (Facts change, and I am compelled to adjust to them).
5) Lastly, the single most common emailed question I recieved after the Cult of the Bears series was this: How on Earth can you be Bullish short term but so Bearish long term? The answer is that I use both techncials for the short term and the macro top down economics work for the longer term.
Shorter term internals / Technicals are positive; Longer term, the Macro is negative.
I do not worry about the day-to-day, focusing instead on trading 30-90 days out, and investing 1 to 2 years. In fact, as to the day-to-day, I'm surprised the response to GDP wasn't more Bullish, along the lines of "Hey, this is proof positve the Fed can now stop!" But that's not my forte, and I never try to guess the day gyrations.
Position: none mentioned
Soros Predicts Recession In 2007
Roger Nusbaum
1/27/06 10:00 AM EST
Why is this news?
We are bumping up on the normal duration of an economic expansion. While a recession may or may not be visible in the current fundamentals, it makes sense to think about just based on how economic cycles usually work.
Position: n/m
El Stinko GDP
Barry Ritholtz
1/27/06 10:16 AM EST
GDP grew at the slowest rate in 3 years. Prior revisions are released seperately; This is a pretty butt ugly prelim number, but it will be revised 2 more times.
As noted yesterday, Economic forecasters have been particularly bad this cycle. So the number being wildly off from consensus carries little meaning . . .
Question for David: Except for slowing the Fed, how do you see a weakening GDP as Good for Stocks?
Position: none mentioned
Barry
Norm Conley
1/27/06 10:22 AM EST
Barry, thanks for your reply. I understand what you are saying. Furthermore, I admire your moxie, brother. Your year-end target on the S&P represents a 31%+ decline from today's prices. An 11-month decline of that magnitude in the S&P is nearly unprecedented and certainly represents a bold call.
I don't think you'll be correct with your prediction. And I think readers (particularly our non-professional readers) should understand that your prediction is (historically speaking) statistically unlikely, to say the least. In essence, you are predicting a crash of epic proportions in the U.S. market. Based upon my reading of market history, spanning several wars and panics, I believe it is very, very unlikely that that the market will undergo a high-magnitude crash during this calendar year - barring (God forbid) some sort of nuclear event or the quick onset of a global war.
All that said, you defend your views well, and I love to read and listen to well-defended contrary viewpoints. Also, if you are correct with your year-end S&P 500 call, your acclaim is going to make Elaine Garzarelli's 1987 Crash prediction look like kindergarten stuff.
Position: none mentioned
Hardly unprecendented
Barry Ritholtz
1/27/06 10:37 AM EST
Hey Norm,
Actually, 25% corrections are more common than most investors realize -- especially in secular bear markets. They are hardly the black swan events many make them out to be.
From 1966-1982, the market saw 5 sell offs of ~25% or more. The chart here shows corrections of 25%, 36%, 45%, 27% and 24% over the course of 16 years. That's one every 38 months or so. Our last 25% correction was July 2002 -- 42 months ago.
So a 31% correction will hardly be an earth shattering event, and if it comes to pass, it will likely be a response to many issues.
When the Business Week predictions came out, and I saw I was the low man, I was, quite frankly, aghast. I assumed I'd be in the bottom quartile or even decile -- but not low man on the totem pole. Remember, we had Bill Gross calling for Dow 5000 and even more Bearish guys saying much worse. I suspect the more Bearish participants just chickened out -- but that's probably because they are smarter than I.
Given that Lions pick off the gazelles that stray from the herd, I would have much preferred to be near the bottom, rather than the outlier . . .
Position: none mentioned
Slow GDP Growth Can Mean Less Demand for Debt Capital
David Merkel
1/27/06 10:56 AM EST
Hi Barry,
Hey, it's partially the Fed, though I still like a final 4.75-5.25% final target for top of the cycle Fed funds. The Fed rarely stops at neutral.
But a slower economy would mean less incentive for businesses and consumers to borrow money. In the short run, that would moderate rises in yields, and much as this is an unpopular concept, would deepen the degree of the eventual yield curve inversion. One thing in the way of this thesis, is the relatively high degree of Treasury borrowing. Corporates will have a record year for issuance, but I believe that is because there is a record amount of bonds to refinance.
Many investment grade rated firms have free cash flow yields that exceed their bond yields. Bond yields are one of the main factors underpinning the market as a whole. If yields fall, bonds will provide even less competition to stocks, absent a depression.
All of this is intermediate-term in nature, which in this case means a year or so. (and, as a final note, my original post said could, not would... this is by no means a certainty.) That help?
Position: none
One last thing...
Norm Conley
1/27/06 11:27 AM EST
Barry, what makes your year-end S&P 500 prediction so much of an outlier is not so much the depth of the decline you anticipate, but the time period into which it would have to be compressed. The smaller the time period one is looking at, the harder it is to "fit" a huge correction.
As an extreme example, if someone predicted a 50% decline in the Dow by next Friday, they might rightly claim that it is a possible outcome. Possible, yes, but so improbable as to be discounted out of hand. It's not that the 50% decline is so unlikely in and of itself, it's that a decline of that magnitude happening within a week's time is truly an infinitessimal possibility.
Your prediction is nowhere near as extreme as the example above. Your chart points out five 25%+ corrections in the 1966 to 1982 period. But only one of those five - the 1966 correction - happened in a short-enough timespan to make it close to meeting the criteria for your anticipated 2006 correction. To wit, the 1966 correction represented a decline of 25% crammed into a 9-month period. The other corrections on the chart are stretched out over longer periods of time: from 12 months all the way to 32 months. So your chart reinforces my point (that massive corrections crammed into short periods of time are crazy-rare) better than it buttresses your prediction.
A better analysis would be to run rolling annual returns on the S&P 500, by month, over the last 80 years since 1926. Then one could build a bell-curve of historical returns. I haven't done this yet, but I'm smelling a project that might be worthwhile. I'm willing to bet that a 31% decline within 11 or 12 months' time would find itself nestled way to the left of the distribution curve.
I hope readers understand that I'm not "hating" on Barry. I've made my own outlier predictions on this site - for example I incorrectly predicted outlier returns to the upside for the S&P 500 in 2004 and 2005 - so I don't think Barry deserves any contempt at all for making his call. To the contrary, well-supported bold predictions are refreshing and great fodder for healthy debate.
Also, I don't think the S&P has to crash 31% for Barry to claim victory on his prediction. A 10% or 15% correction would make him directionally correct. I know I would hold his arm up in victory, were that to occur. Also, that sort of correction is much, much more likely in the context of market history.
Position: none mentioned
Trend vs. Levels
Barry Ritholtz
1/27/06 11:46 AM EST
Hey Norm and Guy,
I'm the first guy to admit that no one has any idea of precisely what is going to happen.
However, the BW [Business Week, A.L.] forecasts -- written late November and published early December -- raise the bar even higher. They try to get 3 things precisely correct: The direction, the level, and the timing. It's no coincidence that no one ever "wins" two years in a row, and if the cutoff date were moved forward or back a week or so, the winning bids would be very different. So there's a ton of randomness as to where precisely stocks will be in 52 weeks.
Norm, for me to take a "victory lap," I would need to see the market top out in 1H (really, Q1) and then sell off (directional prediction) for most of the rest of the year. I would hardly claim a 5-10% drop an accurate call (level); Anywhere near 1,000 on the SPX would make it a decent call.
A friend emailed me this "parachute" -- "Hey, you can always flip Bullish inQ2 if you feel like it." Its good to know that people are already thinking up excuses for me!
Position: Lunchtime!
Optionen
| Antwort einfügen |
| Boardmail an "Anti Lemming" |
|
Wertpapier:
BP plc
|
2
Bernanke startet in kritischer Phase
von Mark Schieritz, Frankfurt
Der neue US-Notenbankchef Ben Bernanke übernimmt die Verantwortung für die amerikanische Wirtschaft nach Einschätzung von Ökonomen in einer kritischen Phase. Sie sehen die US-Wirtschaft in einer prekärer Lage und streiten um Greenspans Bilanz.
"Alan Greenspan hinterlässt ein schweres Erbe. Er hat es geschafft, die Wirtschaft wachsen zu lassen, aber uns zugleich große Probleme beschert", sagte Wirtschaftsnobelpreisträger Joseph Stiglitz der FTD.
Die Aussagen machen deutlich, wie umstritten die Bilanz Greenspans ist. Der Fed-Chef steuerte die US-Wirtschaft durch den längsten Boom in ihrer Geschichte. Zugleich hadern die Amerikaner allerdings mit einem Rekorddefizit in der Leistungsbilanz und einer extrem niedrigen Sparquote.
Zwar gehen die meisten Volkswirte davon aus, dass sich die amerikanische Konjunktur von dem Wachstumseinbruch im vierten Quartal 2005 schnell wieder erholt. "Wir glauben, dass wir wie schon zu Jahresbeginn 2005 wieder ein kräftiges Wachstum sehen werden", sagte Peter Hooper, US-Chefvolkswirt der Deutschen Bank.
Allerdings fürchten viele Ökonomen mittelfristig eine Abkühlung am Immobilienmarkt. Damit droht ein Rückschlag für den Konsum, der das US-Wachstum in den vergangenen Jahren entscheidend gestützt hat. Für Greenspan-Kritiker ist der starke Preisauftrieb an den Häusermärkten längst nicht mehr mit ökonomischen Rahmendaten vereinbar. Daran trage vor allem die Fed Schuld, die mit ihren niedrigen Zinsen den Boom angeheizt und die Amerikaner in die Verschuldung getrieben habe - nur um nach dem Platzen der Aktienblase die Wirtschaft schnell wieder anzukurbeln. Diese Übertreibungen müssten jetzt korrigiert werden. Zum Jahresende hat sich die Immobiliendynamik bereits abgeschwächt.
Diese Interpretation wird allerdings nicht von allen Ökonomen geteilt. Hooper geht davon aus, dass ein Absturz der Wirtschaft verhindert werden kann. Der Arbeitsmarkt komme zunehmend in Fahrt, weshalb die Verbraucher weniger auf Wertgewinne ihrer Immobilien angewiesen seien, um den Konsum zu finanzieren.
Richard Berner, US-Chefvolkswirt bei Morgan Stanley, sagte, es sei alles in allem noch zu früh, um Greenspans Erbe endgültig zu beurteilen. "Ob seine Strategie aufgegangen ist, muss die Geschichte erst noch zeigen."
Was die nächsten Monate betrifft, so gehen die Skeptiker davon aus, dass Bernanke der Fed erst einmal eine Pause verordnen wird. Die Notenbank werde auf ihrer letzten Sitzung unter Greenspan am Dienstag die Zinsen um 25 Basispunkte auf dann 4,5 Prozent erhöhen. Damit sei der Zinserhöhungskurs aber zunächst beendet. Hooper dagegen prognostiziert, dass der Leitzins auf 5,0 Prozent steigen wird.
Optionen
| Antwort einfügen |
| Boardmail an "Anti Lemming" |
|
Wertpapier:
BP plc
|
1
nur kann ich mir momentan nicht vorstellen das das nach oben sein wird...
Optionen
| Antwort einfügen |
| Boardmail an "Pate100" |
|
Wertpapier:
BP plc
|
1
Steigende Kurse
Lohnt jetzt der Einstieg bei Dax, Dow Jones, Gold?
Von VOLKER MIESS
Expertenrat§
Lohnt jetzt der Einstieg bei Dax, Dow Jones und Gold?
Wo gibt's die Top-Angebote?
Die Aktienkurse steigen und steigen: Der Dax (Deutscher Aktienindex) hat die Schwelle von 5600 Punkten übersprungen (hier geht's zum aktuellen Stand) . Und auch der Dow-Jones-Index bewegt sich seit Jahresanfang um die 11.000-Punkte-Marke. Sogar der Goldpreis schafft mit 565 Dollar (466 Euro) je Unze ein 25-Jahres-Hoch. Positive Stimmung an den Börsen. Immer mehr Anleger erwarten sich jetzt hohe Renditen.
Der Handelsumsatz deutscher Aktien ist im letzten Jahr um 25 Prozent gegenüber dem Vorjahr gestiegen. Ein Ende der Hochphase ist (noch) nicht abzusehen. Auch die US-amerikanische Börse brummt.
Viele Anleger steigen jetzt erst ein und hoffen darauf, daß sich die Entwicklung fortsetzt. Aber ist es jetzt nicht zu spät?
[Erwähnung berechtigter Zweifel - A.L.]
Können sie noch mit einem steigenden Dax oder Dow Jones rechnen? Professor Gerke, Börsenexperte an der Universität Erlangen: „Die aktuelle Wirtschaftslage spricht für weitere Kurssteigerungen.“
[Zerstreuung der Zweifel durch "Wirtschafts-Professor" - A.L.]
Vom Allzeithoch ist der Dax allerdings noch weit entfernt: Am 7. März 2000 feierten die Aktionäre einen Stand von 8136,16 Punkten.
[Irrationales Kursziel zur Untermauerung der Kaufthese - A.L.]
Damals boomte die sogenannte „New Economy“ mit Firmen, die im und mit dem Internet Geschäfte machen wollten. Dann ging es erstmal bergab: Seinen letzten Tiefststand erreichte der Dax am 12. März 2003 mit 2188,75 Zählern.
Warum steigen die Leitindizes Dax und Dow Jones wieder stetig? Wie lange hält der Höhenflug an? Triumph oder Trauma für die Anleger? Bild.T-Online und Börsenexperte Professor Gerke beantworten die wichtigsten Fragen. Klicken Sie hier!
Und das sagt Gerke im Interview:
BILD: 1. Der Dow Jones bewegt sich um die 11.000-Punkte-Marke, der Dax springt über die 5500-Punkte-Marke. Wieso sind die Kurse so stark gestiegen?
Professor Gerke: „Die meisten großen Unternehmen im Dow Jones und Dax verdienen blendend. Die Analysten setzen darauf, daß sich das 2006 fortsetzt.“
BILD 2. Handelt es sich um ein Strohfeuer oder können Anleger mit weiter steigenden Kursen in Deutschland und den USA rechnen?
Professor Gerke: „Insbesondere Deutschland wurde im Crash übertrieben heruntergeprügelt. Bei uns brennt folglich kein Strohfeuer. Die aktuelle Wirtschaftslage spricht für weitere Kurssteigerungen. Der Dax ist zur Zeit interessanter als der Dow Jones.“
BILD 3. Welche Risiken lauern bei der weiteren Entwicklung von Dax und Dow Jones?
Professor Gerke: „Größtes Risiko für den Dow Jones sind terroristische Anschläge. Das größte Risiko für den Dax besteht in der mangelnden Reformbereitschaft der Politiker.“
BILD 4. Wie erklären Sie den hohen Goldkurs? Welche Chancen und Risiken haben momentan Anlagen in Gold?
Professor Gerke: „Gold wirft keine Zinsen ab. Es eignet sich deshalb für Krisengläubige und Spekulanten. Ansonsten empfehle ich es nur zum Schmücken der geliebten Frau oder Geliebten. Es läßt sich nur schwer vorhersagen, wann die Notenbanken Goldbestände verkaufen.“
[korrekte Antwort: Profis werden immer risikoscheuer - A.L.]
BILD 5. Es gibt eine Menge Möglichkeiten, Geldanlagegeschäfte zu tätigen. Welches sind Ihrer Meinung nach die drei am besten geeigneten für
a) Gelegenheitsanleger?
Professor Gerke: „Sparpläne, damit Gelegenheitsanleger zu Dauersparern für die Altersvorsorge werden. Ansonsten kurz laufende Staatsanleihen.“
b) Börsenneulinge?
Professor Gerke: „Indexzertifikate und Investmentfonds mit weltweit gestreuter Aktienanlage.“
BILD 6. Welche Streuung nach Wirtschaftsbranchen sollten Anleger in ihrem Portfolio berücksichtigen?
Professor Gerke: „Es empfiehlt sich bei den Aktien eine breite Streuung wie z. B. im Euro Stoxx .“
BILD 7. Welche Regionen oder Märkte sollten in einem ausgewogenen Portfolio abgebildet sein?
Professor Gerke: „Mindestens 40 Prozent, besser 60 Prozent sollten im Ausland angelegt werden. Davon dann ca. 50 Prozent in Europa, der Rest in Asien und den USA. Wer bereits eine Immobilie besitzt, sollte nicht noch zusätzlich in Immobilienfonds investieren.“
BILD 8. Welches sind die schlimmsten Fehler, die Gelegenheitsbörsianer oder Börsenneulinge machen?
Professor Gerke: „Begeisterung für ein einziges Unternehmen oder Investment. Dies bedeutet Glücksspiel.“
Quelle: http://www.bild.t-online.de/BTO/index.html
Der Quellen-Server vereinigt den Volksverdummer Nr. (BILD) mit dem "Volksaktien"-Abzocker Nr. 1 (Telekom/T-Online)
Moderation
Zeitpunkt: 30.04.12 11:29
Aktion: Löschung des Anhangs
Kommentar: Erotischer Inhalt
Zeitpunkt: 30.04.12 11:29
Aktion: Löschung des Anhangs
Kommentar: Erotischer Inhalt
Optionen
| Antwort einfügen |
| Boardmail an "Anti Lemming" |
|
Wertpapier:
BP plc
|
0
(Das Bild findet sich auf derselben Seite, in der obiger Börsen-Artikel in BILD erschien).
Optionen
| Antwort einfügen |
| Boardmail an "Anti Lemming" |
|
Wertpapier:
BP plc
|
0
Darauf haben viele Beobachter gewartet: Aktien sind wieder zum Thema der BILD-Zeitung geworden. Kehrt damit der Kursrausch zurück, der das Platzen der Börsenblase vor sechs Jahren einleitete?
BILD entdeckt die Börse
Die Aufmachung des Themas auf den Internet-Seiten des Boulevard-Blattes ruft Erinnerungen an die Hochzeiten der "New Economy" wach. Inhaltlich eher dünn, aber dafür mit klickträchtigen "Experten-Tipps" versehen fragt die Zeitung: "Lohnt jetzt der Einstieg bei Dax, Dow Jones, Gold?" Links und rechts vom Haupttext kann sich der findige BILD-Leser gleich noch eine fundierte Meinung bilden: Da gibt es Aktien-Analysen per Mausklick, es werden die besten "WM-Aktien" beschrieben und es wird erklärt: "Daran erkennen Sie die besten Aktien von morgen".
Wieder mal "schnell reich"?
Eine derartige Vorliebe für Börsenthemen konnte bei der BILD-Zeitung kurz vor dem Ende des Börsenbooms im Jahr 2000 schon einmal beobachtet werden. Damals stellte die Zeitung in Vertretung vieler Kleinanleger zum Beispiel die Frage: "Geldrausch! Kann ich auch reich werden?" Reich wurden Börsenneulinge in dieser Zeit vor allem an der Erfahrung, dass Börse keine Einbahnstraße ist, und dass Aktienkurse fallen und tiefe Löcher in die eigenen Ersparnisse reißen können.
Die BILD-Zeitung hat sich in der Finanzgemeinde seither den Ruf eines "Kontra-Indikators" erworben. Soll heißen: Wenn private Anleger auf Empfehlungen der Massenmedien in den Aktienmarkt einsteigen, ist bei Profis bereits wieder höchste Vorsicht angesagt. Die "Lemminge" in der Nahrungskette der Finanzmärkte sorgen durch ihren Kaufansturm dann oft für ein letztes Kursfeuerwerk, bevor die Kurse in sich zusammenbrechen.
Gewinne halten noch mit Börsenbewertung mit
Die Lage ist Anfang 2006 allerdings aus Sicht der überwiegenden Mehrheit der Aktienanalysten und –Strategen noch nicht ganz so kritisch wie im Vorfeld des Dauer-Crashs ab Mitte 2000. Zwar ist der Dax im vergangenen Jahr um atemberaubende 27 Prozent gestiegen, der kleine Bruder MDax brachte es sogar auf mehr als 36 Prozent. Doch noch stimmt das Verhältnis von Börsenwert und Gewinnen bei den großen börsennotierten Gesellschaften trotzdem noch. Das Kurs-Gewinn-Verhältnis (KGV) beim Dax liegt derzeit bei knapp 13, der MDax ist mit dem 16fachen der durchschnittlich erwarteten Gewinne des laufenden Jahres bewertet.
Noch sind die Aktienmärkte außerdem nicht wirklich "heiß" gelaufen. So ist der Dax, trotz verbesserter Gewinnsituation fast aller seiner Unternehmen noch weit entfernt von den mehr als 8000 Punkten, die er im Frühjahr 2000 erreicht hatte. Der japanische Nikkei-Index, der derzeit in aller Munde ist, stand einst bei mehr als 40.000 Punkten, derzeit macht sich das Börsenbarometer in Fernost auf in Richtung 17.000 Zähler. Und die Börsen an Wall Street sind zuletzt sogar in eher schlechter Verfassung gewesen. Der Dow Jones-Index verlor im vergangenen Jahr leicht an Wert und pendelt seit zwei Jahren zwischen 10.000 und 11.000 Punkten.
Noch keine IPO-Flut
Und die Zahl der Börsengänge hat gerade in Deutschland noch lange nicht das Ausmaß der Jahre 2000 und 2001 erreicht. Damals starteten insgesamt mehr als 300 Unternehmen alleine an den "Neuen Markt". Viele waren selbst kaum am Markt präsent und hatten ein Geschäftsmodell, das einer kritischeren Beurteilung kaum Stand gehalten hätte.
Erste Überhitzungs-Signale
Noch dürfte es sich also im wesentlichen um eine gut fundierte Hausse an den Börsen handeln. Anleger sind dennoch gut beraten, erste Überhitzungs-Phänomene gut im Auge zu behalten. Heftige Kursausschläge bei Solaraktien nach Bekanntwerden eines Förderprogramms in den USA konnten auch von Analysten "nicht mehr rational" erklärt werden.
Ähnlich schwierig dürfte das bei den Kurssprüngen von Börsenneulingen wie Neosino sein. Die Aktie des Nanotech-Unternehmens reitet auf einer Welle der Begeisterung und hat sich gegenüber dem Ausgabepreis von 55,55 Euro innerhalb von vier Wochen verdreifacht. Bei Kursen um 150 Euro kommt das Unternehmen auf einen Börsenwert von 210 Millionen Euro; bei einem Umsatz von 0,35 Millionen Euro im vergangenen Jahr.
Optionen
| Antwort einfügen |
| Boardmail an "FlamingMoe" |
|
Wertpapier:
BP plc
|
2
1.2.2006
Offene Immobilienfonds - Blanke Nerven
Unter den Investoren offener Immobilienfonds wächst eine Nervosität, die nicht mehr rational erklärbar ist. Innerhalb von nur 24 Stunden haben Investoren 700 Mio. Euro aus dem Kan Am Grundinvest abgezogen.
Fünf Wochen nach der ersten Schließung eines offenen Immobilienfonds überhaupt, seinerzeit durch die Deutsche Bank, ist nun schon der dritte Fonds in die Knie gegangen. Die Krise frisst sich fort und könnte im schlimmsten Fall zu einer Panik werden. Bedroht ist die ganze Branche, die fast 90 Mrd. Euro, vor allem zur Altersvorsorge von Kleinsparern, verwaltet.
Dass es diese Woche zwei kerngesunde Fonds traf, die nicht wie der überwiegend in Deutschland engagierte Grundbesitz-Invest der Deutschen Bank unter überbewerteten Objekten leiden, ist schwer nachvollziehbar. Kan Am hatte vor allem im europäischen Ausland und in den USA investiert. Anders als hier zu Lande florieren dort die Immobilienmärkte, die Objekte des Fonds waren gut vermietet und warfen ordentliche Renditen ab.
Auslöser der jüngsten Massenflucht war allein die Verkaufsempfehlung einer Rating-Agentur, die auf Bilanzierungsprobleme bei Kan Ams amerikanischem Partner Mills aufmerksam gemacht hatte. Der am Donnerstag geschlossene Kan-Am-Fonds Grundinvest war von den Problemen bei Mills aber in keiner Weise betroffen.
Die Gefahr ist nun, dass aus einem bislang überwiegend theoretischen Risiko, das in der Konstruktion des Produkts steckt, ein realer Crash wird. Es ist, als verbreite sich in einem voll besetzten Kino die Nachricht, dass der Saal bei einem hypothetischen Feuer zur Todesfalle werden könnte. Obwohl es gar nicht brennt, wird das Publikum plötzlich hektisch, die Sicherheitslage labil.
Offene Immobilienfonds investieren das Geld der Anleger sehr langfristig, versprechen aber zugleich, Anteile täglich zurückzunehmen. Eine Verkaufswelle der Investoren wird so zur Bedrohung.
Ironischerweise waren es vor allem Sparkassen und Volksbanken, die jetzt ihre Eigenanlagen verkauften und Kan Am in Bedrängnis brachten. Dabei hatten sie gerade erst aus den schwächelnden verbundeigenen Fonds von Deka und Difa zu Kan Am umgeschichtet. Anders als Kleinsparer, denen sie das Produkt stets als wertstabile, langfristige Anlage verkauft hatten, sind die Banken selbst keine treuen Kunden. Sie zerstören dabei letztlich ihr eigenes Produkt.
Das zeigt einmal mehr, dass nach einer dringend nötigen Reform institutionelle Anleger nicht mehr unbeschränkt Millionenbeträge in Immobilienfonds parken und wieder abziehen dürfen. Dies destabilisiert eine Anlageklasse, für die es trotz der Renditeprobleme einiger im Inland überinvestierter Fonds immer noch eine große Nachfrage gibt.
Aus der FTD vom 20.01.2006
Optionen
| Antwort einfügen |
| Boardmail an "Anti Lemming" |
|
Wertpapier:
BP plc
|
0
Google, FOMC tug on stock futures
Auto sales, ISM survey, Time Warner earnings ahead
By Steve Goldstein, MarketWatch
Last Update: 5:30 AM ET Feb. 1, 2006
§
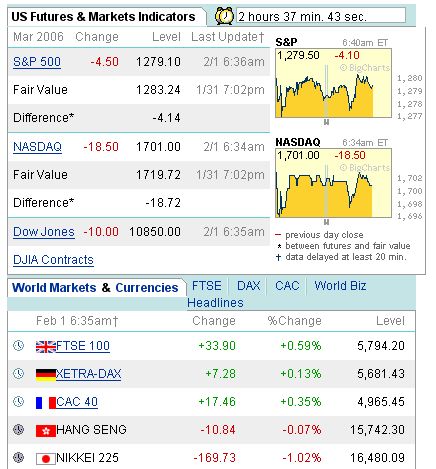
LONDON (MarketWatch) -- Google Inc.'s fourth-quarter earnings disappointment and some overhang from the Federal Open Market Committee's somewhat hawkish view on U.S. interest rates weighed on U.S. stock market futures on Wednesday.
S&P 500 futures were down 3.6 points at 1,280.0 and Nasdaq 100 futures tumbled 16.5 points at 1,703.0.
U.S. markets were coming off a mildly weaker session on Tuesday, when Dow industrials fell 35 points to 10,864, the S&P 500 dipped 5.1 points at 1,280 and the Nasdaq Composite eased 1 point at 2,305, after the Fed said further rate hikes "may be needed."
The dollar rose on both the euro and yen in European trading, with one euro recently worth $1.2119 and a dollar trading at 117.62 yen.
But while the statement didn't leave a completely neutral slate for the incoming Fed chairman, Ben Bernanke, it was Google (GOOG) that produced the day's biggest shocker.
A surprisingly high tax rate kept Google's fourth-quarter profit growth to a mere 82%, resulting in its earnings per share missing consensus forecasts by 22 cents, the company said after markets had closed on Tuesday. The stock was trading at $375.62 in Frankfurt on Wednesday, down over $57 from Tuesday's close.
"Without the higher tax rate, they met (expectations), but even if they did meet, it probably would have sparked a sell-off because expectations were so high," said Romeo Dator, who co-manages the All-American Equity Fund for U.S. Global Investors in San Antonio.
On Wednesday's earnings agenda are results from Time Warner (TWX) , The Boeing Co. (BA) and Anheuser-Busch Companies (BUD).
January U.S. auto sales are also on the docket.
On the economic front, the Institute for Supply Management's manufacturing sentiment index is expected to remain close to the revised 55.6% reading for December. Economists polled by MarketWatch see a contraction to 55.4%.
In Europe, the similar NTC Research eurozone manufacturing purchasing managers index edged lower to 53.5 in January from 53.6 in December. The U.K. manufacturing purchasing managers index rose to 51.7 in January from a revised higher 51.3 reading in December.
Weekly U.S. energy supplies data also is due for release, with expectations of another build in gasoline and distillate inventories.
Front-month crude oil was down 53 cents at $67.39 a barrel in electronic trade.
Elsewhere, Procter & Gamble (PG) agreed to pay up to $577 million, and $10 million upfront, in milestones to develop and commercialize Nastech Pharmaceutical's (NSTK) nasal spray to treat osteoporosis. The spray is currently in Phase III development.
Angiotech Pharmaceuticals Inc. (ANPI) has agreed to buy privately held medical devices maker American Medical Instruments Holdings for $785 million, The Wall Street Journal reported Wednesday.
Overseas, European stock markets shed early losses to post a mild rise behind stronger profits than forecast at drugmaker Roche Holdings and U.K. satellite broadcaster BSkyB, which is partly-owned by News Corp. (NWS)
The Nikkei 225 closed 1% lower in Tokyo.
Japanese electronics group Sharp Corp. posted a 26% quarterly profit on demand for LCD televisions and mobile phones.
Steve Goldstein is MarketWatch's London bureau chief.
Optionen
| Antwort einfügen |
| Boardmail an "Anti Lemming" |
|
Wertpapier:
BP plc
|
Angehängte Grafik:
Screen_00003.jpg
Screen_00003.jpg
1
Cooper schreibt im Artikel unten, dass das desolate Chartbild von Google dem des SP-500 ähnelt.
Im zweiten Absatz ist auch ein Beispiel für einen "positiven Kontraindikator" aufgeführt: Am Langzeittief des Aktienmarktes 1982 erschien in "Business Week" der Artikel "Tod der Aktien-Anlage" ("Death of Equities"). Er markierte punktgenau das Tief. Von da an ging's bergauf.
Technical Analysis
Google Breaks With the Cycles
By Jeff Cooper
Street Insight Contributor
2/1/2006 7:02 AM EST
It never ceases to amaze me how the news many times breaks with the cycles. It never ceases to amaze me how the news headlines -- especially in a well-known magazine -- often coincide with significant turning points, only to see the markets move in a contrary direction to the headlines.
One of the most famous such headlines was the "Death of Equities" headline in Business Week at the very low in 1982 before the blastoff. There are abundant examples of such occurrences.
Very recently, an analyst went on TV and put out a $2,000 target on Google (GOOG:Nasdaq) . This was after the stock had broken from $475 down to $400 and below its 50-day moving average.
The moral of the story is you just can't afford to pay any price for any stock no matter how good the story. It reminds me of a brilliant friend of mine who seemed to have trouble working the markets -- this friend knew the price of everything and the value of nothing.
After hours, Google was down precipitously after missing the mark on earnings. Although a higher tax rate helps explain the miss, the psychology and not the rationales were prevailing in after-market trading. That is often the case after the cycles begin to exert their pressure. So we must pay heed.
Trading long for no other reason than because the stock is going up is fine. After all, I'm a technician and I trade big-picture and short-term patterns without much authentication from fundamentals at all. I believe the Street can't keep a secret -- that the smart money almost always leaves its tracks in the form of buying and selling on the charts. That said, it certainly looks like somebody knew something Jan. 20 when Google had its biggest one-day loss and slammed through its 50-day moving average. Just askin'?
The excuse by the bulls that day was the refusal of Google to comply with a government inquiry into users' activity based on privacy concerns. Be that as it may, momentum for momentum's sake works well if you are willing to run for the exits when the plug is pulled.
The recent bounce in Google traced out a Right Shoulder. The break of the $400 Neckline tonight gives a projection to $325 -- interestingly right around the level of the stock's rising 200 DMA. When they pull the plug, they pull the plug. When they put the hook in, they seldom let you off until blood is drawn.
Recently I showed a chart on Google pointing to the three drives to a potential high and a break of the 50 DMA. It reminds me of an old Wall Street bromide: Your first loss is your best loss.
The bounce in Google from $400 to $450 post-break (in other words, after its recent breakdown) was sharp, quick and impressive. However, if you're a trader and didn't exit after the stock had overbalanced its uptrend on Jan. 20, you're in the "House of Pain" tonight.
Of course, Google may yet go to $2,000 a share in the long term. But, as they say in a rain dance, timing is everything. In the long-term, Porky Pig may also walk through the wall, but in the long term we're all history. As traders, we have to live and die by the here-and-now sword.
Conclusion: We have been concerned about the possibility of a spike top and reversal in January. The chart of the S&P 500 is not all that different from that of Google. A break in the S&P back below our 1275 pivot and especially 1270 that sticks would more than suggest that, following the Principle of Tests, the S&P run-up to test its high (the S&P tagged the low of its high-bar day recently) would suggest that the recent swing low at 1259/1260 was the midpoint of a leg down.
Jeff Cooper is the creator of the Hit and Run Methodology and the author of the best-selling books Hit and Run Trading (The Short-Term Stock Traders' Bible), Hit and Run II (Capturing Explosive Short-Term Moves in Stocks), as well as a video course, Jeff Cooper on Dominating the Day Trading Market. He also created the Hit and Run Nightly Reports and co-founded a trading markets Internet site.
Optionen
| Antwort einfügen |
| Boardmail an "Anti Lemming" |
|
Wertpapier:
BP plc
|
0
sind sogar einige ganz interessante Sachen dabei.
Na egal das ganze nimmt doch langsam Formen an!
Sieht gut aus...
Optionen
| Antwort einfügen |
| Boardmail an "Pate100" |
|
Wertpapier:
BP plc
|
0
(SPY ist der Tracking Stock auf den SP-500.)
Optionen
| Antwort einfügen |
| Boardmail an "Anti Lemming" |
|
Wertpapier:
BP plc
|
0
Wenn du längerfristig denkst würde ich noch etwas warten.
Ich werde jedenfalls noch nichts machen. Ich hab Zeit.
Warte noch auf die charttechnische Bestätigung!
Gruss Pate
Optionen
| Antwort einfügen |
| Boardmail an "Pate100" |
|
Wertpapier:
BP plc
|
5
Während es auf den Euro 0 % Realzinsen gibt (2,25 % steuerpflichtige Zinsen bei minus 2,25 % Inflation), gibt es auf den Dollar derzeit 2,5 % Realzinsen, die bis zum Sommer auf 3 % steigen könnten. Weiterer Vorteil: Cash muss man nicht ständig beobachten wie Aktien.
Aktien kauf ich erst nach einer kräftigen Korrektur des Gesamtmarktes wieder. In den letzten Jahren wurde der Dollar stets teurer (zum Euro), wenn die Märkte fielen. Es ist daher sinnvoll, die jetzigen günstigen Dollar-Kurse zu nutzen (ich bin de facto schon im November 2004 zu 1,3450 eingestiegen, siehe mein Dollar-Long-Thread, EK gepostet).
Da nun schon die BILD-Zeitung zum Einstieg in Aktien trommelt (Posting 16), ist das Ende der Hausse vermutlich nicht mehr fern. Bleibt man in Cash, hat man sozusagen "mit der Vergangenheit abgeschlossen". Man fängt - bezogen auf Aktien - "blitzsauber" bei Null an. Tabula rasa. Das hat auch was. Ich würde als Neu-Investor jedenfalls nicht mein Geld in die derzeit überhitzen Aktienmärkte stecken.
In cash kann man geduldig auf den nächsten Knall warten. Das ist IMHO lukrativer, als die jetzt vielleicht noch möglichen 10 % nach oben mitzunehmen. Nur wenn ich in Cash bin, kann ich bei einem solchen Knall - der nach überraschenden Terrorattacken JEDERZEIT kommen kann - überhaupt kaufen. Warte ich in Aktien, so fällt mein Depot mit dem Gesamtmarkt und das Kapital für Neukäufe wird aufgefressen. (Besonders nervend ist, wenn die Börsen, wie nach den September-Attacken 2001, mehrere Tage geschlossen sind, um dann 20 % tiefer wieder zu eröffnen.)
Rücksetzer um 25 %, die statistisch alle 34 Monate auftreten, bieten hervorragende Einstiegsmöglichkeiten. Meist fallen die Kurse V-förmig - über Wochen im Stück, wobei die Steilheit gegen Ende zunimmt und in freien Fall übergeht. Das Tief ist meist erreicht, wenn die Zahl neuer 52-Wochen-Tiefs an der NYSE knapp unter 1000 liegt und die Volatilität (VIX) auf 40 % steigt.
Nach solchen Kapitulationen geht es dann meist ebenso steil wieder nach oben. Dann kann man - bei sehr geringem Risiko - 25 % in wenigen Monaten verdienen - wenn man Banken und Versicherungen kauft, die in solchen Sitationen besonders stark fallen, sind auch schnelle 50 % drin. Mit Optionen und Futures kann man auch bequem über 100 % machen. Das ist weit weniger riskant als eine Turnaround-Spekulation in einer Einzelaktie. Man kann sogar den Index kaufen (auch über Hebelpapiere), was perfekte Risikostreuung garantiert. Interessant sind auch Sub-Indizes, wie der S&P-500-Financials.
Die Idee, man soll immer zu 100 % investiert sein, ist pure Ideologie. Sie wird gestreut von Fonds, die dazu gezwungen sind. Denn sie werden an ihrer Performance im Vergleich zu den Indizes gemessen. Steigen die Indizes um 10 %, der Fond aber nicht, weil er in Cash ist, so würden Tausende kündigen. Fallen die Indizes hingegen um 30 %, der Fond aber nur um 25 %, kann er sich damit brüsten, um "5 % besser als der Index" abgeschnitten zu haben. Nichtsdestotrotz sind 25 % des Anlegerkapitals vernichtet.
Fonds sind viel zu groß, als dass sie bei Problemen auf die Schnelle aussteigen könnten, ohne die Kurse nahe Null zu schicken. Der Riesenvorteil von Kleinanlegern gegenüber den Fonds ist ja gerade die ungeheure Flexibilität. Wenn ich mich entschließe, schnell mal eben auszusteigen, beeinflusst dass den Markt überhaupt nicht. Das Gleiche gilt bei meinem Wiedereinstieg. Diesen Trumpf gedenke ich auch in Zukunft zu nutzen.
FAZIT: Fonds sind für Dummköpfe, die von den Fonds propagierten Halte-Strategien (ohne Wenn und Aber durch Dick und Dünn) ebenfalls.
Optionen
| Antwort einfügen |
| Boardmail an "Anti Lemming" |
|
Wertpapier:
BP plc
|