


Top-Foren
|
|
|
|
|---|---|---|
| Gesamt | 72 | 1701 |
| Börse | 21 | 984 |
| Talk | 42 | 539 |
| Blockchain | 8 | 199 |
| Hot-Stocks | 9 | 178 |
| Devisen | 8 | 55 |
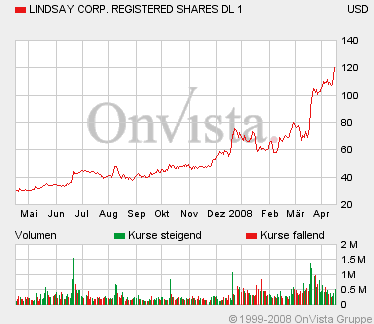
Lindsay - Strong Buy Umsatz +70%
|
Seite 1 von 1
neuester Beitrag: 18.04.08 00:01
|
||||
| eröffnet am: | 18.04.08 00:01 von: | DasMünz | Anzahl Beiträge: | 1 |
| neuester Beitrag: | 18.04.08 00:01 von: | DasMünz | Leser gesamt: | 11280 |
| davon Heute: | 28 | |||
| bewertet mit 1 Stern |
||||
|
|
||||
 Thread abonnieren
|
--button_text--
interessant
|
|
witzig
|
|
gut analysiert
|
|
informativ
|
1


Second Quarter Results
Second quarter fiscal 2008 total revenues increased 70 percent to $108.4 million from $63.7 million for the year-ago period. Net earnings were $9.7 million or $0.79 per diluted share, compared with $2.5 million or $0.21 per diluted share, in the prior year’s second quarter. The quarter includes the results from Watertronics, Inc., which was acquired on January 24, 2008 and Snoline SPA, which was acquired on December 27, 2006. The quarter also includes an increase in income tax expense of $610,000 and corresponding increase of 3.9 points in the effective tax rate related to Section 162(m) of the Internal Revenue Code which limits the deductible portion of executive compensation. The impact of this provision was a reduction in net earnings of $0.05 per diluted share in the period.
Total irrigation equipment revenues increased 62 percent to $82.6 million from $50.9 million in the prior fiscal year’s second quarter. Domestic irrigation revenues increased 44 percent, while international irrigation revenues improved 113 percent from the prior year’s quarter. Infrastructure revenues were $25.8 million compared with $12.7 million in the prior year period, increasing 103 percent.
Gross margin improved to 27.7 percent from 22.7 percent a year ago due to improved margins in both operating segments. Operating expenses of $14.2 million, an increase of $3.4 million from the prior year quarter, were 13.1 percent of sales, compared with 16.9 percent of sales in the year ago period. The increased spending was primarily due to the inclusion of Watertronics, Inc. and personnel related costs. Operating income during the quarter was $15.9 million, compared with $3.7 million in the prior year period.
The backlog of unshipped orders at February 29, 2008 was $98.5 million compared with $38.4 million at February 28, 2007. Irrigation backlog increased $58.6 million ($55.6 million prior to the inclusion of Watertronics) on significantly improved order flow for both domestic and international markets. Infrastructure backlog increased $1.5 million.
Rick Parod, president and chief executive officer, commented, “Demand for irrigation equipment is strong globally, supported by higher commodity prices, bio fuel expansion and water initiatives. Infrastructure segment demand for the unique solutions provided by our products is also strong and we continued to realize synergies from the acquisitions in this segment during the period. Our factories responded to this demand with significant production increases. During the quarter we continued to expand the margins through improved efficiencies, volume leverage and cost reduction initiatives.”
Six Month Results
Total revenues for the six months were $184.3 million, a 60 percent increase from $115.2 million for the prior year’s six-month period. Total irrigation equipment revenues of $139.1 million rose 56 percent from a year ago, while infrastructure revenues grew 72 percent, rising to $45.2 million. Net earnings were $14.0 million, or $1.15 per diluted share, compared with $4.3 million, or $0.36 per diluted share, for the first six months of fiscal 2007.
Outlook
Parod added, “With the current USDA forecast of a second consecutive year of record net cash farm income in 2008, we believe domestic demand for our irrigation products will remain robust. International demand is also expected to increase on the strength of higher agricultural commodity prices and global agricultural development. World-wide interest in the unique road safety products in our infrastructure segment provides continued opportunities for superior growth.”
Parod concluded, “We are focused on achieving growth in each of our segments organically and through acquisitions. During the quarter we acquired Watertronics, Inc., a leader in the design, manufacture, and service of water pumping stations and controls for the golf, landscape and municipal markets. This will further enhance Lindsay’s capabilities in providing innovative, turn-key solutions to customers through the integration of proprietary pump station controls and designs. I am happy to welcome their employees, distributors and suppliers to the Lindsay Corporation family. We will continue to leverage our financial flexibility to create shareholder value through a balance of organic growth opportunities, strategic acquisitions, share repurchases, and dividend payments.”
Second-Quarter Conference Call
Lindsay’s fiscal 2008 second quarter investor conference call is scheduled for 11:00 a.m. ET today. The conference call will be simulcast live on the Internet, and can be accessed via the investor relations section of the Company's Web site, www.lindsay.com. The Company will have a slide presentation available to augment management's formal presentation, which will also be accessible via the Company's Web site.
About the Company
Lindsay manufactures and markets irrigation equipment primarily used in agricultural markets which increase or stabilize crop production while conserving water, energy, and labor. The Company also manufactures and markets infrastructure and road safety products through its wholly owned subsidiaries, Barrier Systems Inc. and Snoline S.P.A. At February 29, 2008, Lindsay had approximately 11.9 million shares outstanding, which are traded on the New York Stock Exchange under the symbol LNN.
For more information regarding Lindsay Corporation, see Lindsay's Web site at www.lindsay.com. For more information on the Company's infrastructure products, visit www.barriersystemsinc.com and www.snoline.com
Concerning Forward-looking Statements
This release contains forward-looking statements that are subject to risks and uncertainties and which reflect management's current beliefs and estimates of future economic circumstances, industry conditions, Company performance and financial results. Forward-looking statements include the information concerning possible or assumed future results of operations of the Company and those statements preceded by, followed by or including the words "expectation," "outlook," "could," "may," "should," or similar expressions. For these statements, we claim the protection of the safe harbor for forward-looking statements contained in the Private Securities Litigation Reform Act of 1995.
Lindsay Corporation and Subsidiaries
CONSOLIDATED BALANCE SHEETS
February 29, 2008, February 28, 2007 and August 31, 2007
§
§(Unaudited) (Unaudited)
§February February August
§2008 2007 2007
§
($ in thousands, except par values)
§
ASSETS
Current Assets:
Cash and cash equivalents $ 24,328 $ 15,346 $ 21,022
Marketable securities 496 16,147 27,591
Receivables, net of allowance, $1,198, $829 and $946, respectively 73,597 52,136 46,968
Inventories, net 60,540 44,800 41,099
Deferred income taxes 6,644 5,172 6,108
Other current assets 9,590 6,187 6,990
Total current assets 175,195 139,788 149,778
§
Long-term marketable securities - 473 -
Property, plant and equipment, net 54,679 36,629 44,292
Other intangible assets, net 32,608 26,870 25,830
Goodwill, net 24,406 12,579 16,845
Other noncurrent assets 5,590 4,507 5,460
Total assets $ 292,478 $ 220,846 $ 242,205
§
LIABILITIES AND SHAREHOLDERS' EQUITY
Current Liabilities:
Accounts payable $ 25,855 $ 17,530 $ 18,367
Current portion of long-term debt 6,171 7,285 6,171
Other current liabilities 38,946 21,766 26,964
Total current liabilities 70,972 46,581 51,502
§
Pension benefits liabilities 5,383 5,094 5,384
Long-term debt 43,711 34,881 31,796
Deferred income taxes 9,671 7,504 9,860
Other noncurrent liabilities 3,546 914 2,635
Total liabilities 133,283 94,974 101,177
§
Shareholders' equity:
Preferred stock, ($1 par value, 2,000,000 shares authorized, no shares issued and outstanding)
§- - -
Common stock, ($1 par value, 25,000,000 shares authorized, 17,846,114, 17,685,792 and 17,744,458 shares issued and outstanding in February 2008 and 2007 and August 2007, respectively)
§17,846 17,686 17,744
Capital in excess of stated value 15,353 8,173 11,734
Retained earnings 216,312 195,102 204,750
Less treasury stock (at cost, 5,963,448, 6,048,448 and 5,998,448 shares in February 2008 and 2007 and August 2007, respectively)
§(95,190 ) (96,547 ) (95,749 )
Accumulated other comprehensive income, net 4,874 1,458 2,549
Total shareholders' equity 159,195 125,872 141,028
Total liabilities and shareholders' equity $ 292,478 $ 220,846 $ 242,205
Lindsay Corporation and Subsidiaries
CONSOLIDATED STATEMENTS OF OPERATIONS
For the three-months and six-months ended February 29, 2008 and February 28, 2007
(Unaudited)
§
§
§Three Months Ended Six Months Ended
§
§February February February February
§2008 2007 2008 2007
(in thousands, except per share amounts)
§
Operating revenues $ 108,418 $ 63,674 $ 184,346 $ 115,206
Cost of operating revenues 78,380 49,219 135,012 88,286
Gross profit 30,038 14,455 49,334 26,920
§
Operating expenses:
Selling expense 6,222 4,346 11,352 7,959
General and administrative expense 6,507 5,459 12,651 10,894
Engineering and research expense 1,456 939 2,962 1,745
Total operating expenses 14,185 10,744 26,965 20,598
§
Operating income 15,853 3,711 22,369 6,322
§
Other income (expense):
Interest expense (821 ) (532 ) (1,420 ) (1,019 )
Interest income 377 426 853 1,062
Other income (expense), net 107 10 221 (6 )
§
Earnings before income taxes 15,516 3,615 22,023 6,359
§
Income tax provision 5,836 1,103 7,977 2,064
§
Net earnings $ 9,680 $ 2,512 $ 14,046 $ 4,295
§
§
Basic net earnings per share $ 0.82 $ 0.22 $ 1.19 $ 0.37
§
Diluted net earnings per share $ 0.79 $ 0.21 $ 1.15 $ 0.36
§
§
Average shares outstanding 11,847 11,630 11,806 11,604
Diluted effect of stock equivalents 410 305 436 297
Average shares outstanding assuming dilution 12,257 11,935 12,242 11,901
§
§
Cash dividends per share $ 0.070 $ 0.065 $ 0.140 $ 0.130
Lindsay Corporation and Subsidiaries
CONSOLIDATED STATEMENTS OF CASH FLOWS
For the six-months ended February 29, 2008 and February 28, 2007
(unaudited)
§
§February February
($ in thousands)
§2008 2007
§
CASH FLOWS FROM OPERATING ACTIVITIES:
Net earnings $ 14,046 $ 4,295
Adjustments to reconcile net earnings to net cash used in operating activities:
§
Depreciation and amortization 4,299 3,296
Amortization of marketable securities premiums (discounts), net (15 ) 26
Gain on sale of property, plant and equipment (10 ) (23 )
Provision for uncollectible accounts receivable (96 ) (2 )
Deferred income taxes (52 ) 848
Stock-based compensation expense 1,303 1,023
Other, net (11 ) 65
Changes in assets and liabilities:
Receivables, net (22,715 ) (9,048 )
Inventories, net (15,071 ) (15,147 )
Other current assets (1,748 ) (2,153 )
Accounts payable 5,059 3,810
Other current liabilities 7,247 (2,431 )
Current taxes payable 1,582 (2,172 )
Other noncurrent assets and liabilities (3,885 ) 151
Net cash used in operating activities (10,067 ) (17,462 )
§
CASH FLOWS FROM INVESTING ACTIVITIES:
Purchases of property, plant and equipment (7,269 ) (4,446 )
Proceeds from sale of property, plant and equipment 22 31
Acquisition of business, net of cash acquired (21,504 ) (17,394 )
Purchases of marketable securities available-for-sale (13,860 ) (60,300 )
Proceeds from maturities of marketable securities available-for-sale 40,995 59,680
Net cash used in investing activities (1,616 ) (22,429 )
§
CASH FLOWS FROM FINANCING ACTIVITIES:
Proceeds from issuance of common stock under stock compensation plan 598 1,451
Proceeds from issuance of long-term debt 15,000 14,309
Principal payments on long-term debt (3,085 ) (2,143 )
Excess tax benefits from stock-based compensation 2,357 (197 )
Dividends paid (1,659 ) (1,512 )
Net cash provided by in financing activities 13,211 11,908
§
Effect of exchange rate changes on cash 1,778 (15 )
Net increase (decrease) in cash and cash equivalents 3,306 (27,998 )
Cash and cash equivalents, beginning of period 21,022 43,344
Cash and cash equivalents, end of period $ 24,328 $ 15,346
Lindsay Corporation
David Downing, 402-827-6235
SVP and CFO
or
Halliburton Investor Relations
Jeff Elliott, 972-458-8000
or
Geralyn DeBusk, 972-458-8000
Optionen
| Antwort einfügen |
| Boardmail an "DasMünz" |
|
Wertpapier:
Lindsay
|
Angehängte Grafik:
h_kl.gif
h_kl.gif